The shape of the UK population in 2018 told a familiar story. The large post-war “baby boomer” cohort — visible as a pronounced bulge in the age distribution — had dominated economic life for decades. This generation benefited from stable employment, affordable housing, rising property values, and strong economic growth. Many accumulated substantial housing equity and later inherited increasingly valuable family homes. Comfortable retirements, foreign holidays, and rising living standards were hallmarks of that era.
Six years later, the 2024 population profile reveals a different picture.
Chart 1: UK Population by Age, 2018
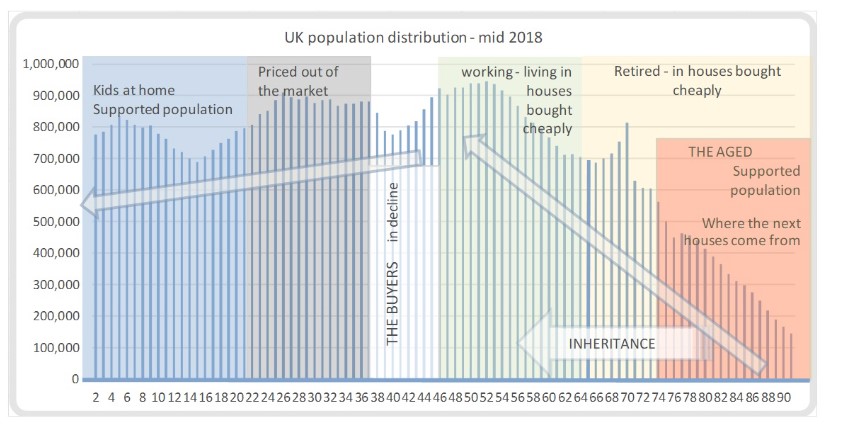
Caption:
The 2018 age distribution shows the prominent post-war baby boomer bulge (right-hand side). At this point, much of this cohort was approaching retirement, holding substantial housing wealth and representing a dominant economic force.
In 2018, the boomer generation was still economically influential. Many remained in work, while others were entering retirement with significant accumulated assets. Their size amplified their impact on housing markets, healthcare demand, pensions, and consumer spending.
A Declining Birth Rate and an Ageing Nation
The most striking feature of the 2024 chart is the continued fall in birth rates — a trend extending back roughly 60 years. The supply of younger workers is no longer expanding fast enough to support a growing retired population. The UK appears to be shifting from demographic expansion to structural ageing.
Chart 2: UK Population by Age, 2024
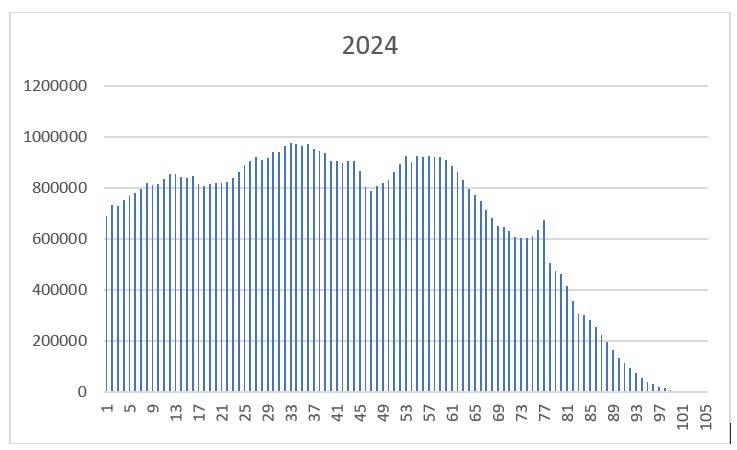
Caption:
By 2024, the baby boomer peak has begun to shrink due to natural attrition, while birth rates remain historically low. The reduction in births highlights a reduced inflow of future workers.
The reduction in the boomer peak reflects ageing and mortality, with the COVID-19 period likely contributing. Meanwhile, the lower birth rate narrows the base of the pyramid, reinforcing long-term workforce constraints.
The 65-year threshold illustrates that the flow into retirement will continue for at least another decade. A comparatively smaller working-age population must generate sufficient tax revenue to fund pensions and healthcare. For now, the boomer generation’s children remain numerous enough to shoulder much of that responsibility.
Projecting Forward: 2030
To understand what happens next, we can shift the 2024 age profile forward by six years.
Chart 3: Projected Change in Age Groups, 2024–2030
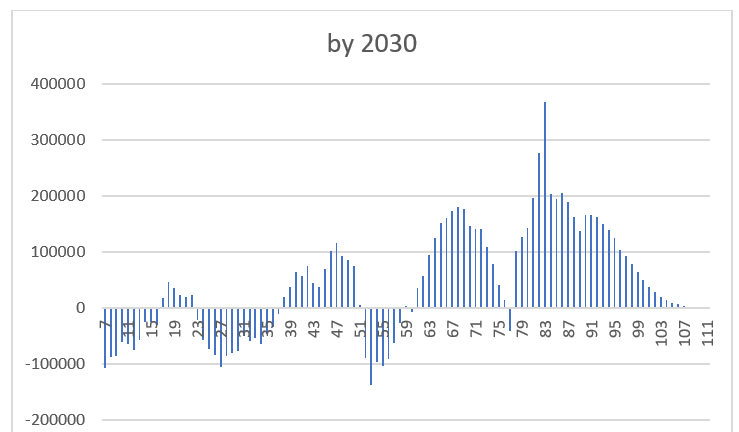
Caption:
Difference chart showing the change in population numbers between 2024 and 2030 (assuming simple age progression). The largest increases occur in older age groups, intensifying pension and healthcare pressures.
Even without adjusting for mortality, the projected increase in older age groups is clear. Given average life expectancy of around 83 years, attrition will reduce the oldest segments, but not before a sustained period of elevated demand on healthcare and pension systems.
The following block represents the steady swell of retirees exiting the workforce.
Extending the Projection: 2034
Looking ten years ahead from the 2024 baseline makes the ageing shift even more pronounced.
Chart 4: Projected Change in Age Groups, 2024–2034
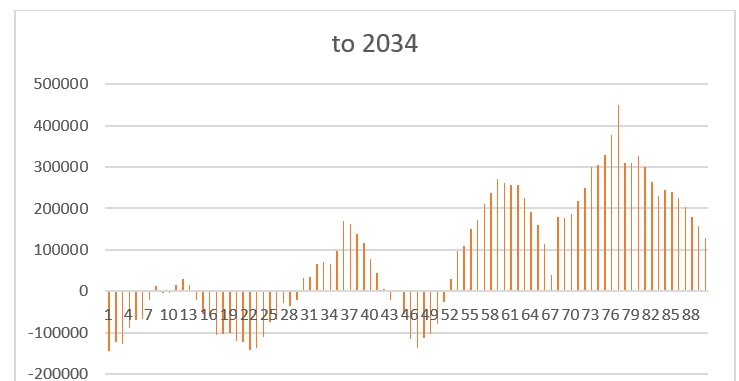
Caption:
Ten-year projection highlighting a substantial expansion in older age cohorts. Figures are measured in hundreds of thousands, underscoring the fiscal significance of demographic ageing.
The scale of the ageing population becomes economically material. Pension liabilities, healthcare costs, and age-related public spending will remain elevated throughout this period.
All pension liabilities are a form of debt – a promise to pay at a future date – and this chart only shows the changes coming. The main blocks from which these figures are derived are still present and significant and yet they do not count as a component of the national debt.
Wealth Transfer and the Housing Question
One frequently raised concern is whether a wave of property sales will destabilise housing markets as older homeowners pass away. This appears unlikely to produce a sudden glut. Much housing will transfer through inheritance rather than open-market sale. Properties are likely to cascade down the generational ladder.
Over the next decade or two, the UK may experience one of the largest intergenerational wealth transfers in its history. For the boomer generation’s children — currently in their prime working years — this could provide relative financial stability during demographic adjustment.
The Longer-Term Challenge
The deeper structural issue emerges further ahead.
When the boomer generation’s children retire — roughly 25 to 30 years from now — they will be followed by a significantly smaller cohort. If birth rates remain subdued, the tax base may struggle to sustain pensions, healthcare, and public services at current levels.
This challenge is not unique to the UK. Across Europe, demographic pressures are intensifying. Countries such as France face similar trajectories, while Germany and Italy confront even sharper ageing profiles.
A Generation That Shaped the Economy
The defining story is the rise and fall of the baby boomer bulge. At peak working age, it drove growth and prosperity. As it aged, economic momentum slowed, pension obligations expanded, and healthcare demands rose.
For the next decade, relative stability is plausible as wealth transfers offset some pressures. Beyond that horizon, demographic arithmetic becomes harder to ignore.
The UK’s long-term prosperity will depend on how effectively it responds — through productivity gains, workforce participation, immigration policy, technological innovation, and pension reform.
Demography is not destiny. But it sets powerful constraints — and the charts suggest the most significant adjustments are still to come.